Announcements
- We are still accepting forms and money for the Family Christmas Skate on December 12th
- Student Led conferences on Thursday
- Return last page of report card
- JK- Grade 2 Christmas Concert December 10th
- Grade 3 - 8 Christmas Concert December 17th
- Student Led conferences on Thursday
- Return last page of report card
- JK- Grade 2 Christmas Concert December 10th
- Grade 3 - 8 Christmas Concert December 17th
Unit of Inquiry
We began our third UOI today: How we Organize Ourselves. In this unit we will learn about the different types of communities and their features, along with factors that contribute to the development of these communities.
First off, take a look at some of us trying to pronounce "Suburban" before we even began our lesson.
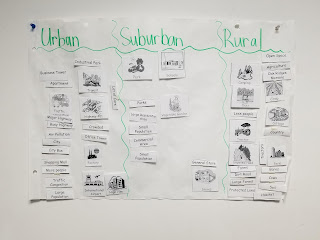
Together we watched a video that explained the difference between Urban, Suburban and Rural communities. The video explained the features of each of these communities and showed us pictures of what each of these communities looked like. After watching the video, students were provided with characteristics from each of these communities and they had to decide which community each feature described. After they stuck them to our chart, we reflected on whether they were in the correct category, and talked about which features can be part of several communities.
Video: https://www.youtube.com/watch?v=vBjB_BlIr7U&list=PLcdK5SbVPtlYQcrs3TMIb0iAuf9obQeP1&index=30&t=0s
Inquiry into Math
Today our learning goal was to be able to interpret information from bar graphs, double bar graphs and pictographs.
Pictographs:
When interpreting data from a pictograph it is SO SO SO important to pay attention to the KEY or else you will misinterpret the data that is provided. The key explains what each symbol in the pictograph represents. Together we looked at how we can solve the value of half a symbol (it would be half the value of the whole symbol). Ex. If a circle = 6, half a circle =3
Bar graphs and Double bar graphs:
When interpreting information from bar and double bar graphs, it's importance to recognize your scale: what the values on your y-axis are increasing by. In addition to this, we discussed the difference between a bar graph and a double bar graph. A double bar graph is used to compare data (ex. boys vs. girls, age groups, etc.). We will dive deeper into these once we get to creating graphs, today was all about interpreting and drawing conclusions. Conclusions are the information you know because of your data (ex. the top selling ice cream was chocolate). For double bar graphs, it is SO SO SO important that we include a legend to identify what each colour bar represents. Lastly, we concluded that the bars in our bar graphs should be spaced out since the data we represent in bar graphs is not continuous.
For all graphs, we talked about the importance of a title and labels on each axis. The title explains what our data represents. The labels explain what each axis represents.
Music, French and Gym
Check out the blogs below to see what your child did during Music and French
French with Mme. Rawan: https://mmerawansja.blogspot.com
Music with Mrs. McMillan: www.mrsmcmillanmusic.blogspot.com
Gym with Ms. Vasconcelos: https://msvphysed.blogspot.com/
Agenda
- Read for 25 minutes
- Math pgs. 78 & 79 & worksheet
- UOI: Urban, Rural and Suburban Worksheets
- Skating form & Money
- Last page of the report card


No comments:
Post a Comment